Code Quality Dashboard
Description
Use the Code Quality Dashboard to view code quality metrics for projects, including code analysis, test and coverage results, and requirements verification status.
Open the Code Quality Dashboard App
Open a project, then use one of these approaches to open the app:
MATLAB® Toolstrip: In the Project tab, in the Tools menu, under Apps, click Code Quality Dashboard.
MATLAB command prompt: Enter
codeQualityDashboard.
Examples
Open Code Quality Dashboard
Open the MATLABShortestPath project.
openProject("MATLABShortestPath");Open the Code Quality Dashboard.
codeQualityDashboard;

Collect Test and Requirements Metric Results
This example shows how to collect test and requirements metric results and reflect the results in the Code Quality Dashboard.
Open the MATLABShortestPath project.
openProject("MATLABShortestPath");Open the Code Quality Dashboard.
codeQualityDashboard
Open the MATLAB Test Manager.
matlabTestManager
Run all tests in the project by clicking the Run button ![]() .
.
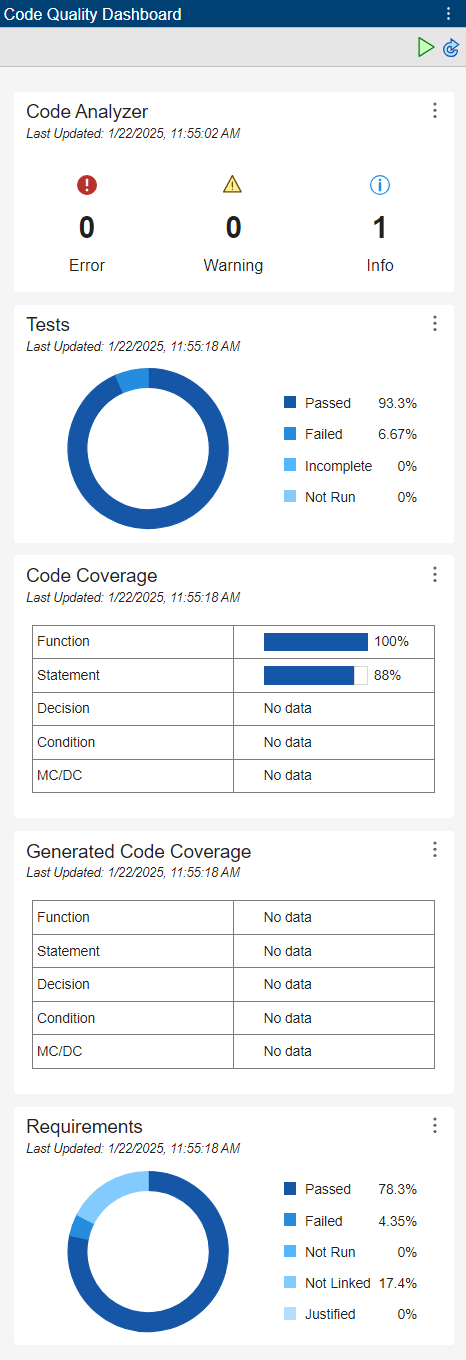
Refresh the Code Quality Dashboard to view the updated results. In the banner, click Update Artifact, then click Refresh All.

Collect Coverage Metric Results
This example shows how to collect coverage metric results and reflect the results in the Code Quality Dashboard.
Open the MATLABShortestPath project.
openProject("MATLABShortestPath");Open the Code Quality Dashboard.
codeQualityDashboard
Open the MATLAB Test Manager.
matlabTestManager
In the toolstrip, click the Coverage button ![]() and select Enable Coverage, then set the coverage metric level to MC/DC.
and select Enable Coverage, then set the coverage metric level to MC/DC.
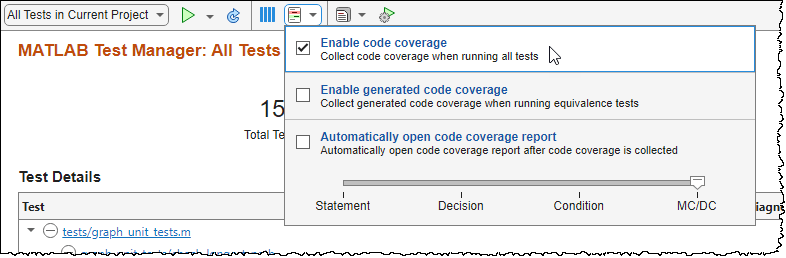
Run tests and collect coverage by clicking the Run button ![]() .
.
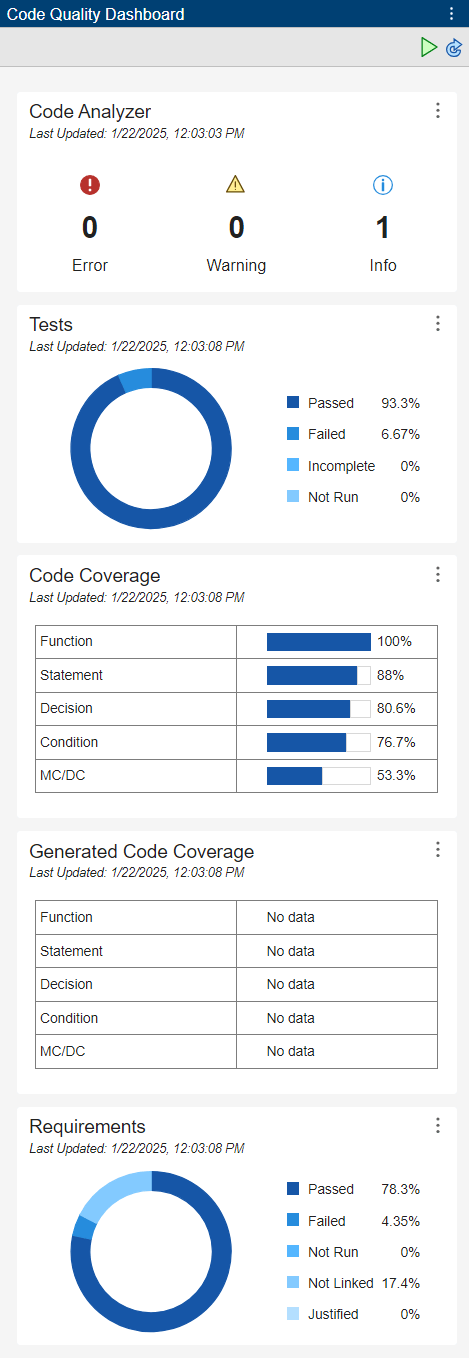
Refresh the coverage metric results in the Code Quality Dashboard. In the banner, click Update Artifact, then click Refresh All.
Version History
Introduced in R2023a
You can also select a web site from the following list:
Americas
- América Latina (Español)
- Canada (English)
- United States (English)
Europe
- Belgium (English)
- Denmark (English)
- Deutschland (Deutsch)
- España (Español)
- Finland (English)
- France (Français)
- Ireland (English)
- Italia (Italiano)
- Luxembourg (English)
- Netherlands (English)
- Norway (English)
- Österreich (Deutsch)
- Portugal (English)
- Sweden (English)
- Switzerland
- United Kingdom (English)