Analyze Performance of the Generated CUDA Code
This example shows you how to analyze and optimize the performance of the generated CUDA® code by using the gpuPerformanceAnalyzer function.
The GPU Coder Performance Analyzer runs a software-in-the-loop (SIL) execution that collects metrics on CPU/GPU activities in the generated code and provides a chronological timeline plot to visualize, identify, and mitigate performance bottlenecks in the generated CUDA code. This example generates the performance analysis report for the Fog Rectification example from GPU Coder. For more information, see Fog Rectification.
Third-Party Prerequisites
CUDA enabled NVIDIA® GPU.
NVIDIA CUDA toolkit and driver.
NVIDIA Nsight™ Systems. For information on the supported versions of the compilers and libraries, see Third-Party Hardware.
Environment variables for the compilers and libraries. For setting up the environment variables, see Setting Up the Prerequisite Products.
The profiling workflow of this example depends on the profiling tools from NVIDIA that accesses GPU performance counters. From CUDA toolkit v10.1, NVIDIA restricts access to performance counters to only admin users. To enable GPU performance counters to be used by all users, see the instructions provided in Permission issue with Performance Counters (NVIDIA).
Verify GPU Environment
To verify that the compilers and libraries necessary for running this example are set up correctly, use the coder.checkGpuInstall function.
envCfg = coder.gpuEnvConfig('host');
envCfg.BasicCodegen = 1;
envCfg.Quiet = 1;
coder.checkGpuInstall(envCfg);
Fog Rectification Algorithm
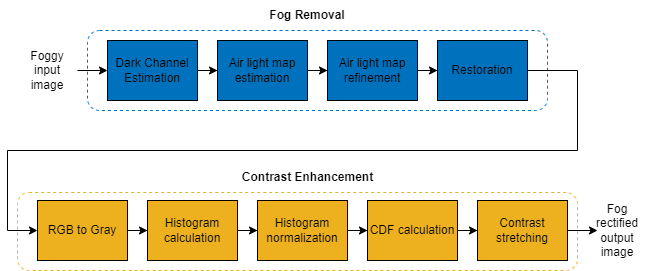
To improve the foggy input image, the algorithm performs fog removal and then contrast enhancement. The diagram shows the steps of both these operations.
This example takes a foggy RGB image as input. To perform fog removal, the algorithm estimates the dark channel of the image, calculates the airlight map based on the dark channel, and refines the airlight map by using filters. The restoration stage creates a defogged image by subtracting the refined airlight map from the input image.
Then, the Contrast Enhancement stage assesses the range of intensity values in the image and uses contrast stretching to expand the range of values and make features stand out more clearly.
type fog_rectification.mfunction [out] = fog_rectification(input) %#codegen
% Copyright 2017-2019 The MathWorks, Inc.
coder.gpu.kernelfun;
% restoreOut is used to store the output of restoration
restoreOut = zeros(size(input),'double');
% Changing the precision level of input image to double
input = double(input)./255;
%% Dark channel Estimation from input
darkChannel = min(input,[],3);
% diff_im is used as input and output variable for anisotropic diffusion
diff_im = 0.9*darkChannel;
num_iter = 3;
% 2D convolution mask for Anisotropic diffusion
hN = [0.0625 0.1250 0.0625; 0.1250 0.2500 0.1250; 0.0625 0.1250 0.0625];
hN = double(hN);
%% Refine dark channel using Anisotropic diffusion.
for t = 1:num_iter
diff_im = conv2(diff_im,hN,'same');
end
%% Reduction with min
diff_im = min(darkChannel,diff_im);
diff_im = 0.6*diff_im ;
%% Parallel element-wise math to compute
% Restoration with inverse Koschmieder's law
factor = 1.0./(1.0-(diff_im));
restoreOut(:,:,1) = (input(:,:,1)-diff_im).*factor;
restoreOut(:,:,2) = (input(:,:,2)-diff_im).*factor;
restoreOut(:,:,3) = (input(:,:,3)-diff_im).*factor;
restoreOut = uint8(255.*restoreOut);
restoreOut = uint8(restoreOut);
%%
% Stretching performs the histogram stretching of the image.
% im is the input color image and p is cdf limit.
% out is the contrast stretched image and cdf is the cumulative prob.
% density function and T is the stretching function.
p = 5;
% RGB to grayscale conversion
im_gray = im2gray(restoreOut);
[row,col] = size(im_gray);
% histogram calculation
[count,~] = imhist(im_gray);
prob = count'/(row*col);
% cumulative Sum calculation
cdf = cumsum(prob(:));
% finding less than particular probability
i1 = length(find(cdf <= (p/100)));
i2 = 255-length(find(cdf >= 1-(p/100)));
o1 = floor(255*.10);
o2 = floor(255*.90);
t1 = (o1/i1)*[0:i1];
t2 = (((o2-o1)/(i2-i1))*[i1+1:i2])-(((o2-o1)/(i2-i1))*i1)+o1;
t3 = (((255-o2)/(255-i2))*[i2+1:255])-(((255-o2)/(255-i2))*i2)+o2;
T = (floor([t1 t2 t3]));
restoreOut(restoreOut == 0) = 1;
u1 = (restoreOut(:,:,1));
u2 = (restoreOut(:,:,2));
u3 = (restoreOut(:,:,3));
% Replacing the value from look up table
out1 = T(u1);
out2 = T(u2);
out3 = T(u3);
out = zeros([size(out1),3], 'uint8');
out(:,:,1) = uint8(out1);
out(:,:,2) = uint8(out2);
out(:,:,3) = uint8(out3);
return
Generate Performance Analyzer Report
To analyze the performance of the generated code using gpuPerformanceAnalyzer, create a code configuration object with a dynamic library ('dll') build type. Because the gpuPerformanceAnalyzer function accepts only an Embedded Coder™ configuration object, enable the option to create a coder.EmbeddedCodeConfig configuration object.
cfg = coder.gpuConfig('dll','ecoder',true);
Run gpuPerformanceAnalyzer with the default iteration count of 2.
inputImage = imread('foggyInput.png');
inputs  = {inputImage};
designFileName = 'fog_rectification';

gpuPerformanceAnalyzer(designFileName, inputs, ...
    'Config', cfg, 'NumIterations', 2);
### Starting GPU code generation
Code generation successful: View report

### GPU code generation finished
### Starting SIL execution for 'fog_rectification'
    To terminate execution: clear fog_rectification_sil
### Host application produced the following standard output (stdout) messages:
Generating '/tmp/nsys-report-540f.qdstrm'

[1/1] [0%                          ] mw_nsysData.nsys-rep
[1/1] [0%                          ] mw_nsysData.nsys-rep
[1/1] [===========50%              ] mw_nsysData.nsys-rep
[1/1] [0%                          ] mw_nsysData.nsys-rep
[1/1] [7%                          ] mw_nsysData.nsys-rep
[1/1] [===========52%              ] mw_nsysData.nsys-rep
[1/1] [========================100%] mw_nsysData.nsys-rep
[1/1] [========================100%] mw_nsysData.nsys-rep
Generated:
    /home/lnarasim/Documents/MATLAB/ExampleManager/lnarasim.Bdoc23a.j2174901/gpucoder-ex87489778/mw_nsysData.nsys-rep

### Stopping SIL execution for 'fog_rectification'
### Starting profiling data processing
### Profiling data processing finished
### Showing profiling data
GPU Performance Analyzer
The GPU Performance Analyzer exposes GPU and CPU activities, events, and performance metrics in a chronological timeline plot to accurately visualize, identify and address performance bottlenecks in the generated CUDA® code.
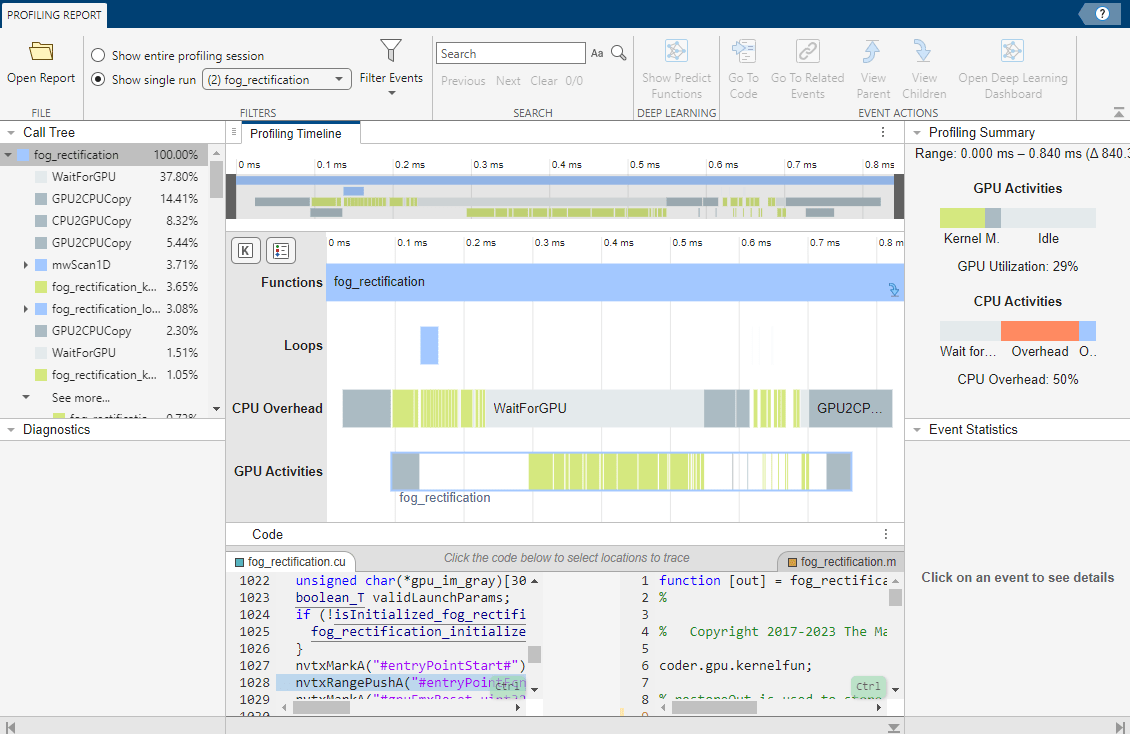
These numbers are representative. The actual values depend on your hardware setup. This profiling was done using MATLAB R2023a on a machine with an 6 core, 3.5GHz Intel® Xeon® CPU, and an NVIDIA TITAN XP GPU.
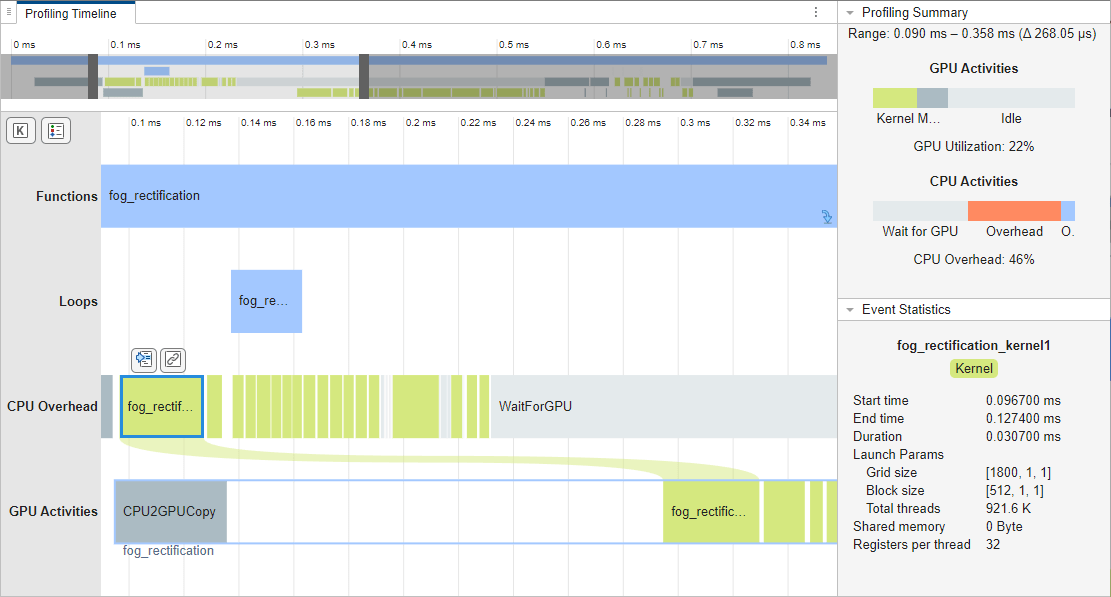
Profiling Timeline
The profiling timeline shows the complete trace of all events that have a runtime higher than the threshold value. A snippet of the profiling trace is shown.
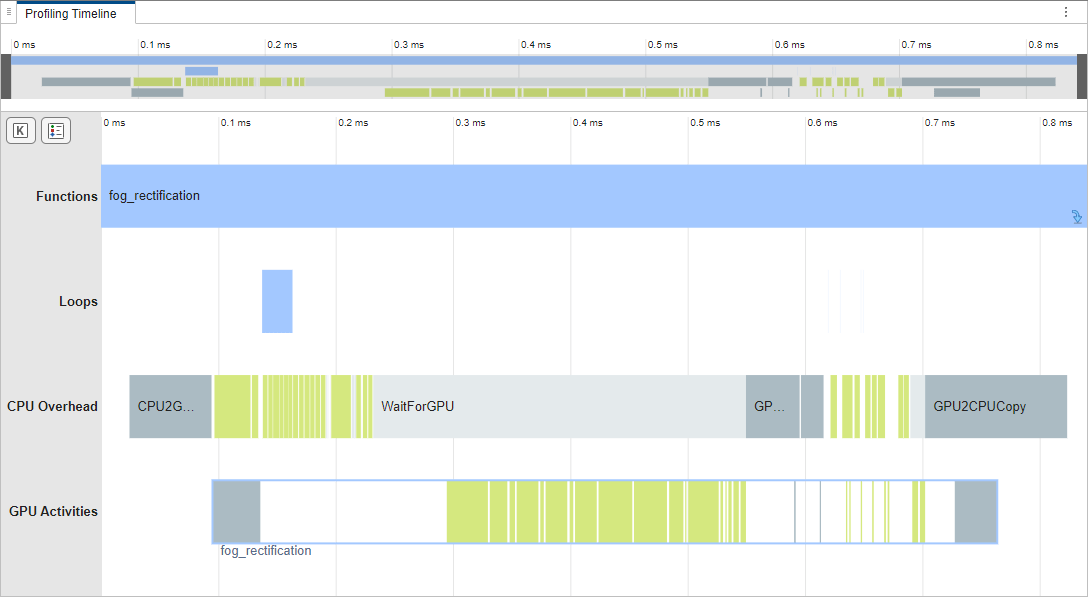
You can use the mouse wheel (or an equivalent touchpad option) to zoom into and out of the timeline. Alternatively, you can use the timeline summary at the top of the panel to zoom and navigate the timeline plot.
The tooltips on each event indicate the start time, end time and duration of the selected event on the CPU and the GPU. It also indicates the time elapsed between the kernel launch on the CPU and the actual execution of the kernel on the GPU.
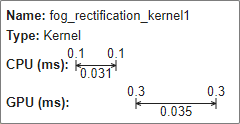
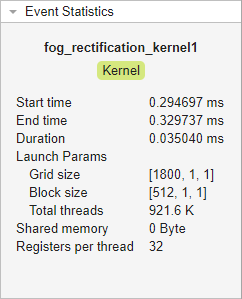
Event statistics
The event statistics panel shows additional information for the selected event. For example, the fog_rectification_kernel1 shows the following statistics:
Insights
The insights panel gives an pie chart overview of the GPU and CPU activities. The pie chart changes according to the zoom level of the profiling timeline. A snippet of the insights panel is shown. Within the region selected on the timeline, it shows that the GPU utilization is only 16%.
Call Tree
This section lists the GPU events called from the CPU. Each event in the call tree lists the execution times as percentages of caller function. This metric can help you to identify performance bottlenecks in generated code. You can also navigate to specific events on the profiling timeline by clicking on the corresponding events in the call tree.
Filters
This section provides filtering options for the report.
View Mode - Use this option to view profiling results for the entire application (including initialization and terminate) or the design function (without initialization and terminate).
Event Threshold - Skip events shorter than the given threshold.
Memory Allocation/Free - Show GPU device memory allocation and deallocation related events on the CPU activities bar.
Memory Transfers - Show host-to-device and device-to-host memory transfers.
Kernels - Show CPU kernel launches and GPU kernel activities.
Others - Show other GPU related events such as synchronization and waiting for GPU.
Improving the Performance of the Fog Rectification
From the performance analyzer report, it is clear that a significant portion of the execution time is spent on memory allocation and deallocation. To improve the performance, you can turn on GPU memory manager and run the analysis again.
cfg = coder.gpuConfig('dll');
cfg.GpuConfig.EnableMemoryManager = true;

gpuPerformanceAnalyzer(designFileName, inputs, ...
    'Config', cfg, 'NumIterations', 2);
### Starting GPU code generation
Code generation successful: View report

### GPU code generation finished
### Starting SIL execution for 'fog_rectification'
    To terminate execution: clear fog_rectification_sil
### Host application produced the following standard output (stdout) messages:
Generating '/tmp/nsys-report-18e6.qdstrm'

[1/1] [0%                          ] mw_nsysData.nsys-rep
[1/1] [0%                          ] mw_nsysData.nsys-rep
[1/1] [5%                          ] mw_nsysData.nsys-rep
[1/1] [===========51%              ] mw_nsysData.nsys-rep
[1/1] [========================97% ] mw_nsysData.nsys-rep
[1/1] [========================100%] mw_nsysData.nsys-rep
Generated:
    /home/lnarasim/Documents/MATLAB/ExampleManager/lnarasim.Bdoc23a.j2174901/gpucoder-ex87489778/mw_nsysData.nsys-rep

### Stopping SIL execution for 'fog_rectification'
### Starting profiling data processing
### Profiling data processing finished
### Showing profiling data
See Also
Functions
Objects
Related Topics
You can also select a web site from the following list:
Americas
- América Latina (Español)
- Canada (English)
- United States (English)
Europe
- Belgium (English)
- Denmark (English)
- Deutschland (Deutsch)
- España (Español)
- Finland (English)
- France (Français)
- Ireland (English)
- Italia (Italiano)
- Luxembourg (English)
- Netherlands (English)
- Norway (English)
- Österreich (Deutsch)
- Portugal (English)
- Sweden (English)
- Switzerland
- United Kingdom (English)