Graphics
Two- and three-dimensional plots, data exploration,
and visualization techniques
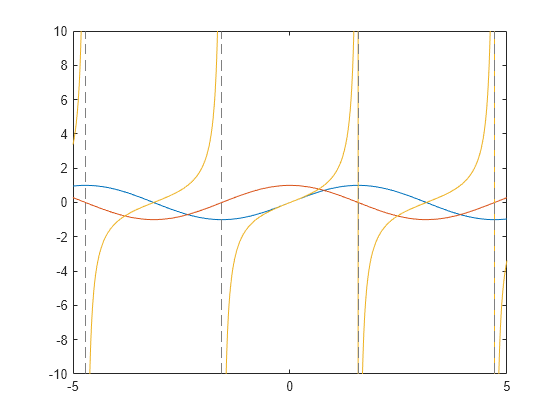
MATLAB® provides many techniques for plotting numerical data. Symbolic Math Toolbox™ expands these graphical capabilities by providing plotting functions for symbolic expressions, equations, and functions. These plots can be in 2-D or 3-D as lines, contours, surfaces, or meshes. You can create plots in Cartesian or polar coordinates. You also can create animated plots.

Functions
Properties
Topics
- Create Plots
Plot symbolic expressions, including parametric or implicit expressions, in 2-D or 3-D as line, contour, or surface plots.
- Transform Spherical Coordinates to Cartesian Coordinates and Plot Analytically
Transform symbolic expressions from spherical to Cartesian coordinates, and plot analytically.
- Tangent Plane and Normal Line of Implicit Surface
Find tangent plane and normal line of implicitly defined surface.
Featured Examples
You can also select a web site from the following list:
Americas
- América Latina (Español)
- Canada (English)
- United States (English)
Europe
- Belgium (English)
- Denmark (English)
- Deutschland (Deutsch)
- España (Español)
- Finland (English)
- France (Français)
- Ireland (English)
- Italia (Italiano)
- Luxembourg (English)
- Netherlands (English)
- Norway (English)
- Österreich (Deutsch)
- Portugal (English)
- Sweden (English)
- Switzerland
- United Kingdom (English)