Measure and Monitor Project Quality
Measure and monitor the quality of MATLAB® code and tests in Projects by
using the Code Quality
Dashboard. The dashboard collects and displays the results for quality metrics for
MATLAB code and test files (.m files) and requirement sets,
including code analysis, test results, coverage results, and requirements
verification.
Monitor Quality Metrics
Open a project, then, in the Project tab, in the Tools section, under Apps, click Code Quality Dashboard.
Note
By default, the dashboard requests that you enable artifact tracing the first time you open a project. Click Enable and Continue to allow the dashboard to track tool outputs and detect outdated metric results.
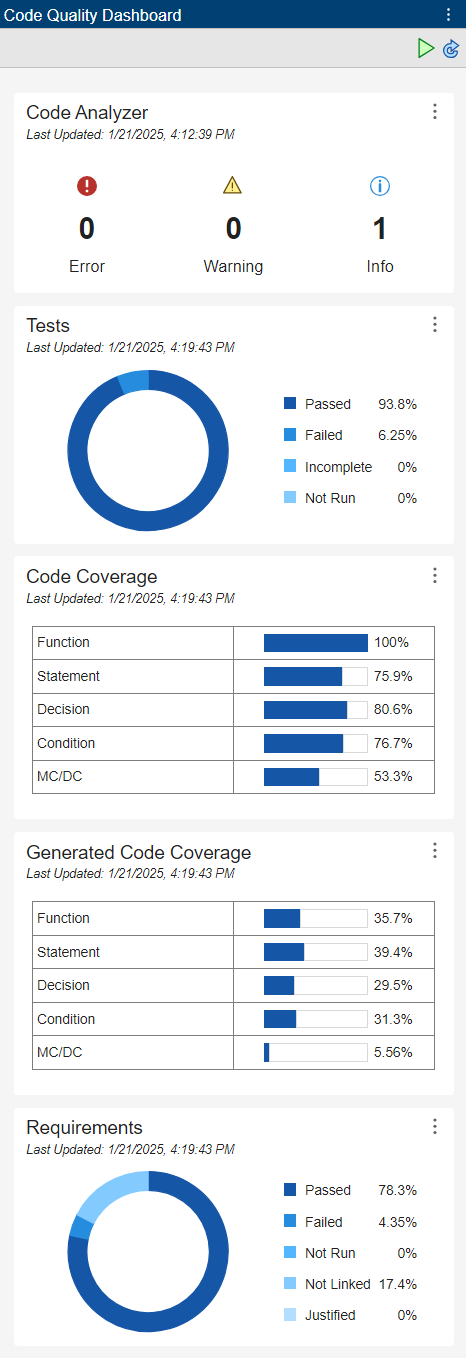
The dashboard has four sections:
Code Analyzer displays coding problems.
Tests displays test results.
Coverage displays coverage results from tests.
Requirements displays requirements verification status.
Check for Coding Problems
The Code Analyzer section displays information about coding errors, warnings, and improvement opportunities for the MATLAB code and test files in your project.
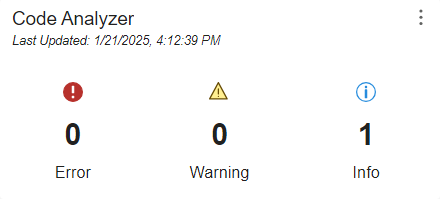
The Code Quality Dashboard uses the MATLAB Code Analyzer to check MATLAB code and test files in the project for coding problems. For more information on the MATLAB Code Analyzer, see Check Code for Errors and Warnings Using the Code Analyzer.
To collect and display code analyzer metric results, update the dashboard. For more information, see Update the Dashboard.
To view details about the coding problems, open the code analyzer report by clicking the Code Analyzer section. For more information, see MATLAB Code Analyzer Report.
Collect Coverage
The Coverage section displays coverage results from the MATLAB Test Manager.
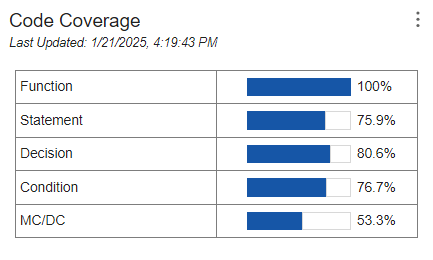
Coverage indicates how your tests execute functions, statements, or conditional logic in your code files. For more information, see Collect Code Coverage Metrics for MATLAB Source Code.
To collect and display coverage metric results, enable coverage in the MATLAB Test Manager, then run all tests in the project. Running test suites or selected tests does not update the coverage metric results for the project.
To view detailed coverage results, open the coverage report by clicking the Coverage section.
Verify Code by Running Tests
The Tests section displays the current test results from the MATLAB Test Manager.

The MATLAB Test Manager manages MATLAB tests and test results for your project. For more information see, Manage Tests and Results by Using the MATLAB Test Manager.
To collect test metric results, run tests by using the MATLAB Test Manager. Running test suites or tests in the project updates the test metric results with aggregated results from multiple runs.
To view detailed test results, open the MATLAB Test Manager by clicking the Tests section.
Verify Requirements
If you have Requirements Toolbox™ installed, the Requirements section displays the requirements verification status for requirements in the project.
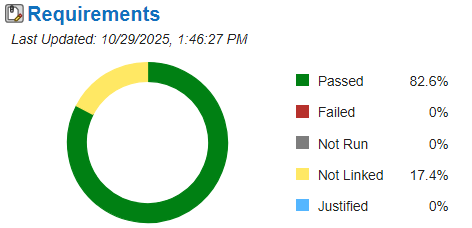
In Requirements Toolbox, requirement verification status reflects the results of verification items linked to requirements, including Simulink® tests. In the Code Quality Dashboard, requirement verification status reflects only the results for linked MATLAB tests run from the MATLAB Test Manager. For more information, see Verify Requirements in Projects with MATLAB Tests.
To collect requirements metric results, run tests by using the MATLAB Test Manager. Running test suites or tests updates the requirements metric results with aggregated results from multiple runs.
To view requirements, open the Requirements Editor by clicking the Requirements section.
Note
Collecting requirements metric results and opening the Requirements Editor requires Requirements Toolbox.
Update the Dashboard
Monitor the quality of your project as you make changes and collect new results by updating the metrics. You can update all metrics in the dashboard or update individual sections.
Update All Metrics
When you make changes to artifacts in the project or collect new results, a banner indicates that project artifacts have changed.
![]()
To retrieve the current status of the project artifacts, click Update Artifacts. If there are more recent results for project artifacts than what is displayed in the dashboard, icons indicate that the metrics are stale.

Additionally, the dashboard displays a banner that indicates that there are stale results.
![]()
To refresh all of the results in the dashboard, click Refresh All.
Update Individual Metrics
To update metric results for an individual section, in that section, click the
three-dot icon ![]() and select Refresh
Data.
and select Refresh
Data.
Alternatively, to simultaneously run tests and update metric results for the
Tests, Coverage, and
Requirements sections, click the three-dot icon ![]() in the section and select Run Tests
and Refresh Data.
in the section and select Run Tests
and Refresh Data.
See Also
Apps
Related Topics
You can also select a web site from the following list:
Americas
- América Latina (Español)
- Canada (English)
- United States (English)
Europe
- Belgium (English)
- Denmark (English)
- Deutschland (Deutsch)
- España (Español)
- Finland (English)
- France (Français)
- Ireland (English)
- Italia (Italiano)
- Luxembourg (English)
- Netherlands (English)
- Norway (English)
- Österreich (Deutsch)
- Portugal (English)
- Sweden (English)
- Switzerland
- United Kingdom (English)